Hi there ![]()
We keep discussing the rating scale and approaches to evaluate ratings so I became curious how the ratings are distributed among different people. There is this “problem” that we are tempted to rate a decent rum an 8.5, not brave enough either to damp or to glorify it. I’d like to see how it looks in numbers ![]()
There was also the other discussion about non-linearity of the rating scale. (Best rums by price categories). I would like to follow this up with a small research. I hve no idea how to collect all the data but it’d be interesting to see the rating trends of individual users.
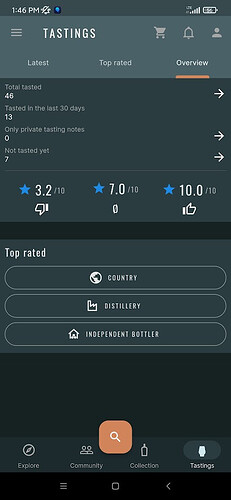
Could you, please, check your Tastings->Overview section in the app and reply with your lowest, average and highest rating? My guess is that the highest value will be the top one so this is pretty uninteresting but the other two n umbers can vary significantly ![]() Let’s research
Let’s research ![]()
- 0.1-1
- 1.1-2
- 2.1-3
- 3.1-4
- 4.1-5
- 5.1-6
- 6.1-7
- 7.1-8
- 8.1-9
- 9.1-10
0 voters
- 0.1-1
- 1.1-2
- 2.1-3
- 3.1-4
- 4.1-5
- 5.1-6
- 6.1-7
- 7.1-8
- 8.1-9
- 9.1-10
0 voters
- 0.1-1
- 1.1-2
- 2.1-3
- 3.1-4
- 4.1-5
- 5.1-6
- 6.1-7
- 7.1-8
- 8.1-9
- 9.1-10
0 voters
